Welcome to Cumorah.com!
International Resources for Latter-day Saints
The Cumorah Project is a privately funded initiative that engages in research and education. All resources developed are made available online at no cost. Our major areas of emphasis include:
- Country and culture research
- Missiology research (church growth, research, education)
- Gospel topics
- Digitization and preparation of electronic texts on related themes
- Development of original resources
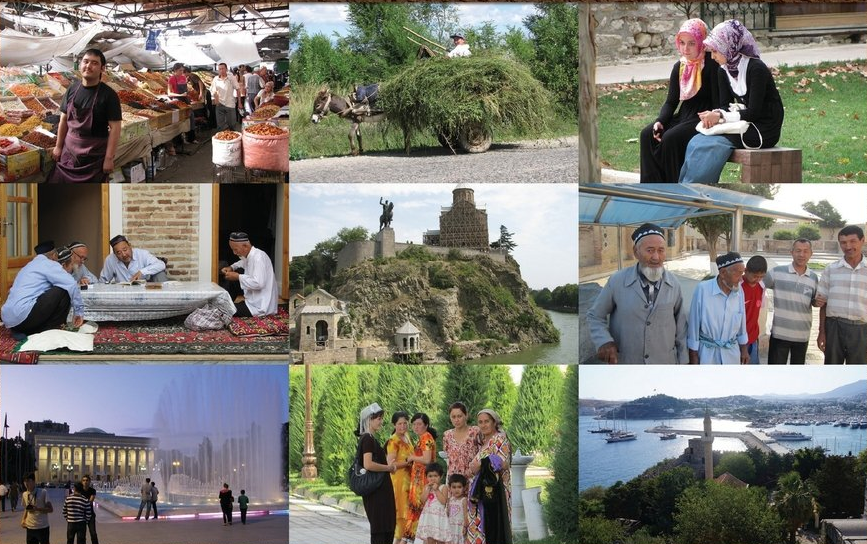
- International photo library
Reaching the Nations International Church Growth Almanac
 Volume 1: The Americas, Oceania and Europe PDF
Volume 2: Asia and Africa PDF
Country reports on the LDS Church around the world from a landmark almanac. Includes detailed analysis of history, context, culture, needs, challenges and opportunities for church growth.

LDS International Atlas - Google Maps
An online atlas providing the location and organizational structure of LDS congregations, missions, stakes, and districts worldwide. The atlas also contains country and state maps of the most populous unreached cities and the status of LDS outreach by ethnolinguistic group. Access the atlas on the left-hand column under "LDS International Atlas - Google Maps." The atlas is strictly for educational purposes. For information regarding LDS meetinghouse locations and times, visit lds.org/maps. Below are links to world regions of the atlas.
Quote of the day!
“Only by giving are you able to receive more than you already have.”
Jim Rohn
A series of case study essays examining successes, challenges, and opportunities for LDS growth worldwide. New case study reports are added regularly.
- LDS Church Growth Case Studies
- Case Studies on Stagnant or Slow LDS Growth
- Case Studies on Analyzing Growth Trends by City or Administrative Division
- Case Studies on Recent LDS Missionary and Church Growth Successes
- Comparative Growth Case Studies
- Prospective LDS Outreach Case Studies
- People-Specific LDS Outreach Case Studies
- Overall LDS Growth Trend Case Studies
More Resources
Law of the Harvest:
- Practical Principles of Effective Missionary Work.
- Original research on effective LDS missionary work around the world.
Cumorah Gospel Library Electronic Text Project
Originally prepared electronic versions of classic LDS texts.
Cumorah Best Books Electronic Text Project
Digitized texts of some of the world's best books. World classics, history, self-improvement, and more.
Words to Live By Quotation Database
Over 2000 inspirational quotations, many related to missionary work. Great for talks or lessons on any topic.
Non-English Gospel and Language Resources
Short missionary-oriented articles and resources in other languages including many original translations of the Cumorah Foundation.